Unlike forecast accuracy measures which have been used widely in practice for decades, Forecast Value Add (FVA) is not as common, but is a very helpful tool for guiding where and how we spend our time in the demand planning process.
Forecast Value Add is a metric that evaluates the performance of various steps in a planning process. Imagine a process that involves the following steps: create a baseline, incorporate promotional assumptions, and approve through a consensus process in which certain risks and opportunities may be adjusted in or out of the plan. If you took a snapshot of the plan at each step along the journey, and then measured the accuracy of each of those plans, we could determine if the changes made in a particular step contributed to making the plan more or less accurate.
While I do believe the theory makes sense, in practice I have yet to encounter organizations that utilize FVA this way. The problem is that it is very difficult to effectively take snapshots of the plan at each step in the planning process, particularly when some of the steps may be iterative. In the lead-up to a consensus meeting there may be many iterations of the plan as teams work through new information, challenge assumptions, and refine models.
Instead, I find that there are 3 snapshots that can be readily managed and measured, and still provide a great deal of value in the measurement of FVA. They are:
| 1 | The Naïve or “do nothing” forecast |
| A naïve forecast (sometimes called a random walk) is one where the future periods will be equal to the most recent actual period. In other words, if I sold 100 this month, I’ll sell 100 next month and so on and so forth. We can make it a bit more sophisticated by incorporating seasonality, which is to simply say the forecast should equal the prior year value for the same period. Why should we care about the accuracy of the “do nothing” forecast? Using this as a starting point is a way of saying that our planning process should at least be yielding a better result than if we had done no planning at all. If you’re not currently taking snapshots of a “do nothing” forecast, don’t worry. It’s typically very easy to infer what the “do nothing” forecast would have been. Just look at what the prior year or most recent actual period value was at the time. | |
| 2 | The statistical baseline forecast |
| This snapshot is of the statistical baseline forecast. This reflects what the plan would be if we relied only on statistical forecasting alone, without adjustments or enrichments from demand planners. | |
| 3 | The Final Demand Plan |
| This snapshot is of the final demand plan, after incorporating inputs and intelligence from Sales and Marketing. |
Using these three snapshots can usually be readily accomplished, as the naïve forecast is either available or could be retroactively calculated, and there is often a separate record of the statistical forecast. There is also very little debate as to what these three snapshots are, and they can be explained to most stakeholders, even those unfamiliar with the details of the planning process.
As described earlier, calculating FVA is a matter of calculating the forecast accuracy of each of these three snapshots, and then evaluating the difference between them. For example:
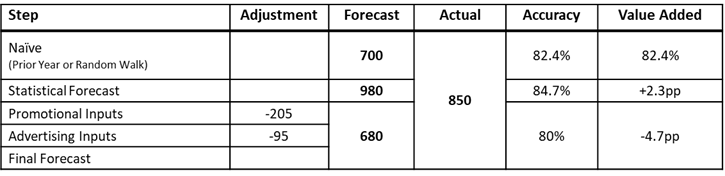
In this example we have illustrated both Promotional and Advertising inputs being incorporated as enrichments to the Statistical Forecast. Note that they are considered part of the same snapshot that gives us the Final Demand Plan.
The conclusion from this example? The promotional and advertising inputs are destroying value. In fact, the final demand plan is less accurate than if we had used the naïve or “do nothing” forecast!
At each step in the FVA measure we want the value-add to be non-negative. A negative FVA tells us that the additional work that we put into improving the plan did not yield any benefit.
FVA should be measured over time, like Bias. Month to month there will be variations, but if over time there is a chronic negative value-add, then it needs to be addressed. The good news is that often the simple solution is to do less work! Simply stop doing the thing that is destroying the value.
